The New York City Subway 2015:

21 lines
469 stations
660 miles of track
Spotty cell signals

The Subspotting project captures, maps and visualizes the available cell phone reception in the entire New York City Subway up until beginning of 2017.


Over a period of two weeks in fall 2015, the Subspotting project logged the cell phone reception of New York City’s four major phone carriers along all 21 lines, 469 stations, and 660 miles of track covered by the MTA.

The result is a historical portrait of the electromagnetic fields of New York City’s underground – a map that highlights the system’s dead spots, stretches of spotty signals and available pockets of connectivity.


Where was your service?

Find out where you had cell phone service on the New York City Subway in 2015!*

* this visualization works with a reduced data set. For the full data, check out the Subspotting app and Subspotting posters.


Did you know?


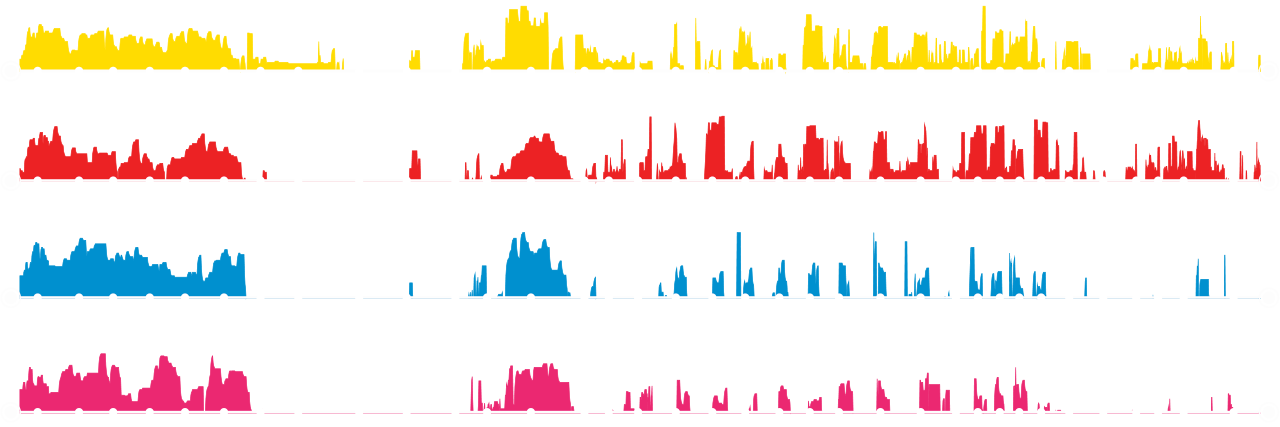
Lines sorted by % of reception along the entire line (Most connected to least)
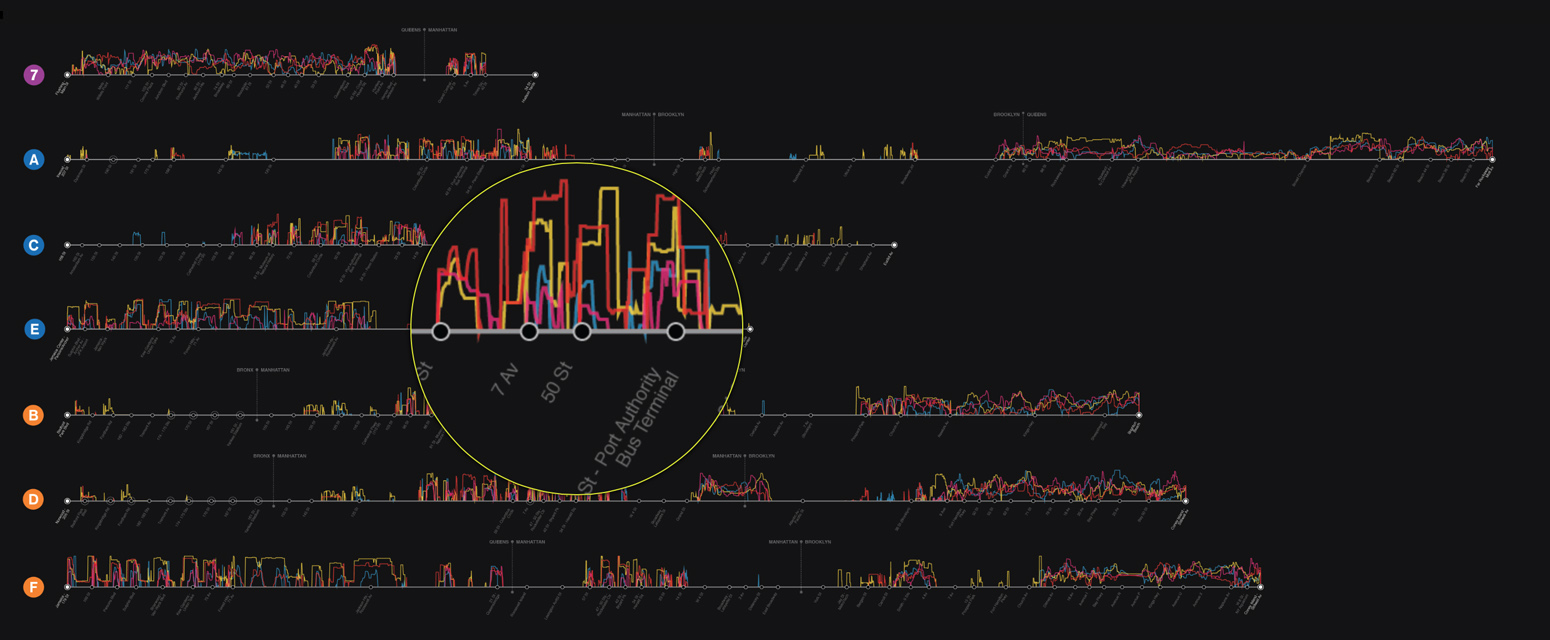


The Most Connected


The 7 train mostly runs aboveground, making it the most connected line with about 79% being connected. Even when going underground in Manhattan, it receives enough stray signals to keep you connected for most of your ride.
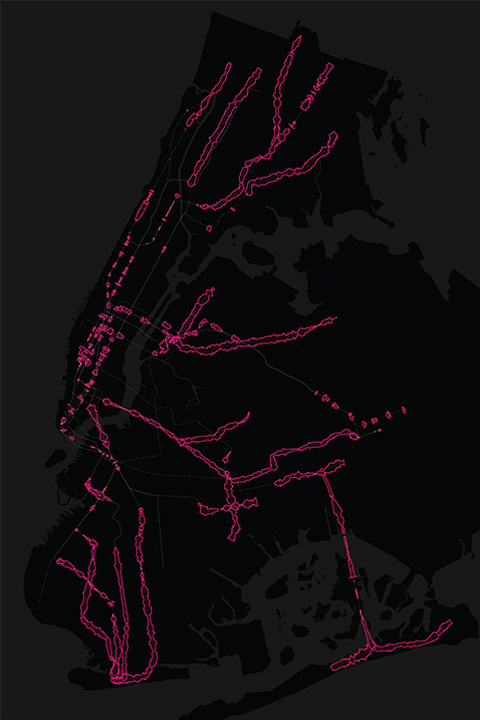


The Least Connected


With only about 12% of its entire length connected, the G train is the least connected train of the subway. You can find just a few tiny pockets of service around Smith / 9th Street and south of Court Square.


Spotty Signals


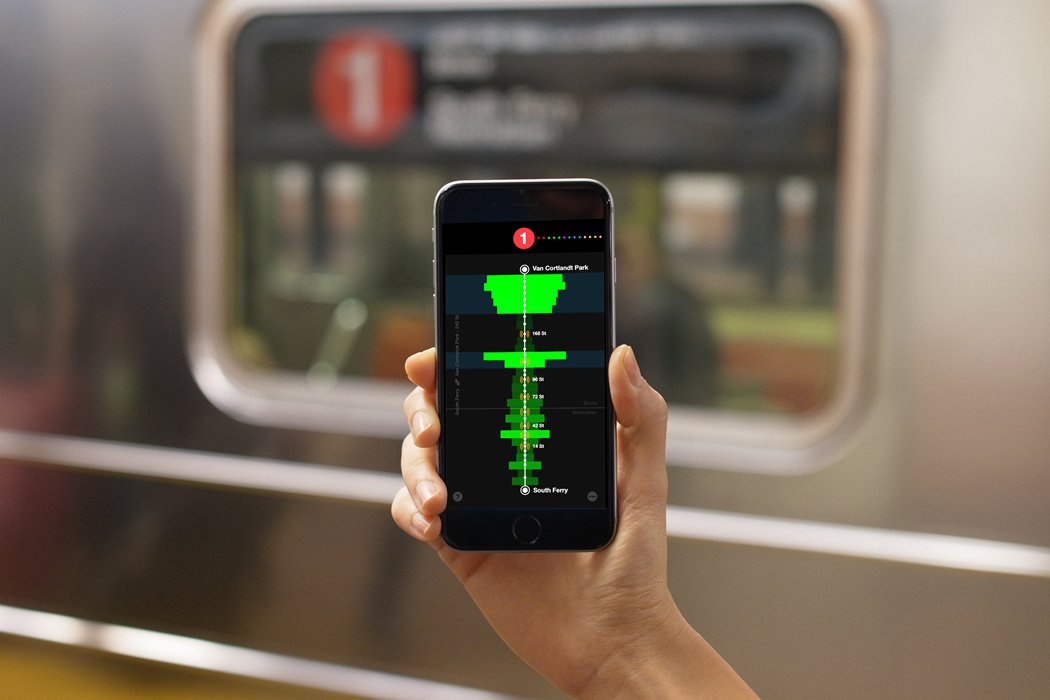
Spotty reception most of the way from South Ferry to 125th Street, due to stray signals from aboveground.


Radio Silence


Be prepared for some radio silence when heading into Brooklyn – you will find almost no reception over there.


Better Be Quick


Make the most of the strong pockets of reception at 8th Ave and 6th Ave - No service again before Wilson Ave when heading east.


Enjoy the View


Send your messages while crossing the Manhattan Bridge, one of the few well- connected spots on the Q. (And, you get a nice view!)


The overall system

Every line, every station, every mile of track - Compare all lines in terms of reception, length, under- and overground stretches


Electromagnetic patterns

Each line has its very own electromagnetic pattern and characteristics, from extended dead spots and pockets of strong reception to spotty service due to stray signals from overground transmitters.


Overground


Around 40% of the MTA’s 660 miles of track run aboveground. Bridges and short aboveground stretches provide reception for brief moments along the journey.


Deadspots


Unlike other subway systems, New York City’s tunnels are currently not equipped with WiFi or cell phone transmitters. So inevitably each of the lines comes with dead spots along the way.


Spotty Signals


Spotty underground signals are caused by stray reception from aboveground cell phone transmitters. Their strength varies according to the depth of the tunnel and even the type of materials in between cell phone transmitter and the tunnel.


Carrier Differences


Each carrier has a different aboveground transmitter density and placement – as you can assume, these also affect their underground coverage.


Where is your carrier?

Reception issues are a constant topic of conversation among New Yorkers –
the coverage maps below show the signal strength for the major carriers underground: AT&T, Sprint, T-Mobile and Verizon.

AT&T

Sprint

T-Mobile

Verizon


Please note!

Cell phone reception is highly variably and changes over time. The Subspotting project provides a historical snapshot of cell phone reception in the New York City subway end of 2015.

The data for these visualizations is based on a one-time measurement of each subway line.


For your pocket

The Subspotting app


Needed to stay connected while underground?

The Subspotting app gave you at-a-glance information on underground cell phone coverage and helped you to pick the right spots for sending your texts on the go.


The background

Since the New York City subway tunnels were not wired for connectivity before 2017, cell phone reception dependended on stray signals from aboveground


The system

New York City’s very first subway line opened back in 1904: the original Eighth Avenue Line connected 207th Street and High Street.

Today, the entire system is comprised of 21 official lines and 469 stations across the five boroughs and carries an average of 5.6 million passengers along its 660 miles of track every day.

In recent years, the MTA has started to equip select stations with WiFi and cell phone transmitters, but due to some remaining lack of connectivity in the tunnels, passengers sometimes rely on stray signals from surface transmitters to send or receive messages in between stations.

Lines
21

Stations
469

Miles of track
660

Daily passengers
5,600,000


The origins of cell phone reception

Mobile phone reception is based on the original discovery of electromagnetic waves in 1886 by German physicist Heinrich Hertz.

Phones today sense the invisible radio waves with their antennas and use the electromagnetic spectrum to connect to different signal transmitters while we move through the city.

Despite the increasing density of phone towers, even reception today still varies depending on proximity to a tower / transmitter and any interference from buildings, trees, and even the weather.


The current situation

A common sight in New York City before 2017:
subway riders finishing up a call before heading into the subway or even fishing for service while underground.


The process

Over the course of two weeks, our data logger travelled the entire subway to create a unique data set that has not been logged in its entirety before.


01 Creating the custom data logger

To record the data, we created a custom app that continuously logged the cell phone reception of each of the four major carriers in two-second intervals: AT&T, Sprint, T-Mobile, and Verizon. Since each phone can only log one carrier at a time, our data logger consisted of four iPhone 5S, all neatly stored in a non-shielded case.


02 Logging the data

Over the course of two weeks, our data logger travelled the entire subway system (once in either direction) to capture this unique data set.
 Planning the logger's route took some time: since several lines use the same track at parts of their route, these parts only needed to be measured once (e.g., the 1, 2, and 3 trains use the same track between 59 St Columbus Circle and 96 St).

Below, the measurements of the 1 train from Van Cortlandt Park to South Ferry. (Sprint, Verizon, AT&T, T-Mobile):


03 Data validation and cleaning

After two weeks of data collection, we validated our results by calculating the correlation between riding the train in both directions to make sure our measurements were accurate.
We cleaned up the data to remove errors and distilled the data into one distinct dataset per line containing the measurements for the four main carriers: AT&T, Verizon, T-Mobile and Sprint.


04 Adding context

While data just by itself can seem mysterious, adding contextual information helps to understand it. Besides adding stations and boroughs to each of the lines we also indicated the WiFi enabled stations as well as underground and overground segments by hand. Below, the contextualized data of the 1 train.


05 Simplifying the data

The original cell phone data was logged in two-second intervals.
To make it usable for the iPhone app, we aggregated the dataset into more comprehensible segments of time (green).


06 The output

Based on this dataset, the app displays each line of the New York City subway with its available cell phone reception. It additionally indicates the WiFi enabled stations, boroughs, and aboveground and underground stretches.


Credits & Contact


Contact:

info@subspotting.nyc

Press material:

Download Presskit

Follow us on Twitter:

@subspotting

Interested in bringing
Subspotting to your city?

Contact us

The Subspotting team:

Daniel Goddemeyer / OFFC

(Concept & Creative Direction)

Founder of OFFC - a research and design practice in New York City that transforms emerging technologies into new products.


Dominikus Baur

(Technical Lead - Web & iOS)

Data visualization and mobile interaction designer, Ph.D. in Media Informatics from the University of Munich.


Contributors:


Noa Younse

(Visualization prototyping)


Adam Harvey

(Prototype / Techn. Consulting)


Bruno Kruse

(Prototype / iOS Coding)


Jessie Braiden

(GIS Support)


Tu Uthaisri

(Video / Filming)


Richard The

(Video / Editing)


Kris Martin

(Video / Editing)


Hilla Katki

(Design Consulting)


Amanda Cho

(Design Consulting)


Adam Surhaja

(Web Prototyping)


Aaron Hill

(Data Logging)


Selected Press Coverage


All route indicators used with permission from the MTA


A project by OFFC © 2016 OFFC NY